
The Zabbix server boasts an extensive range of pre-existing templates, simplifying the process of integrating them with your hosts. If you’re reading this, it’s likely you’ve already set up Zabbix server on your main server and installed Zabbix clients on the remote systems you wish to monitor. For guidance on installing Zabbix Server and Client on various operating systems, consider the following tutorials:
- Install Steps on Ubuntu, Debian – Zabbix Server and Zabbix Agent
- Install Steps on CentOS, RedHat – Zabbix Server and Zabbix Agent
- Install Steps on Windows – Zabbix Agent
There are two main methods to add remote hosts for monitoring to your Zabbix server. The first involves an automatic network scan by Zabbix, which adds all discovered hosts to your server. The alternative method entails manually adding each host individually.
This guide focuses on the manual addition of hosts. Below are the steps to add your first Linux-based host:
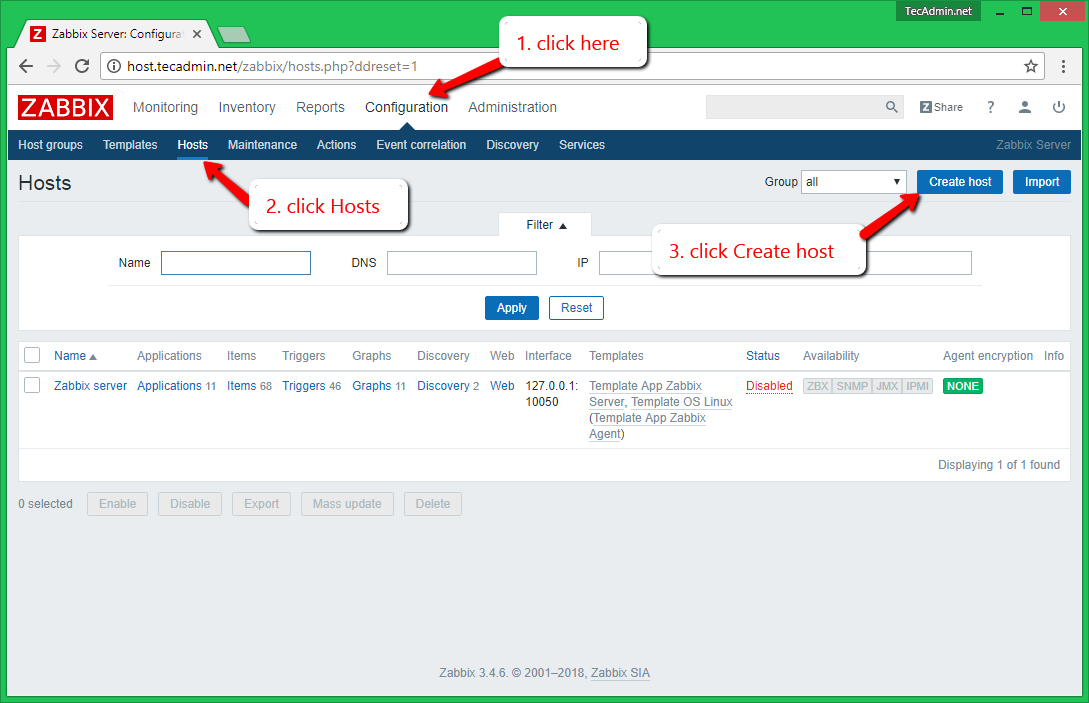
Adding a New Host to Zabbix
- Start by logging into your Zabbix web admin panel with an admin account.
- Follow these steps (also illustrated in the accompanying screenshot):
- Navigate to the ‘Configuration’ Menu.
- Select the ‘Hosts’ submenu.
- Click on ‘Create Host’ on the right-hand side.
- Enter the necessary details of your remote host and then proceed to the ‘Templates’ tab:
- Hostname: Input the hostname of the remote system.
- Visible Name: Assign a display name in Zabbix.
- Group: Choose an appropriate group for your host.
- Agent Interface: Provide details of the Zabbix agent running on the host.
- Enabled: Ensure this is checked to activate.
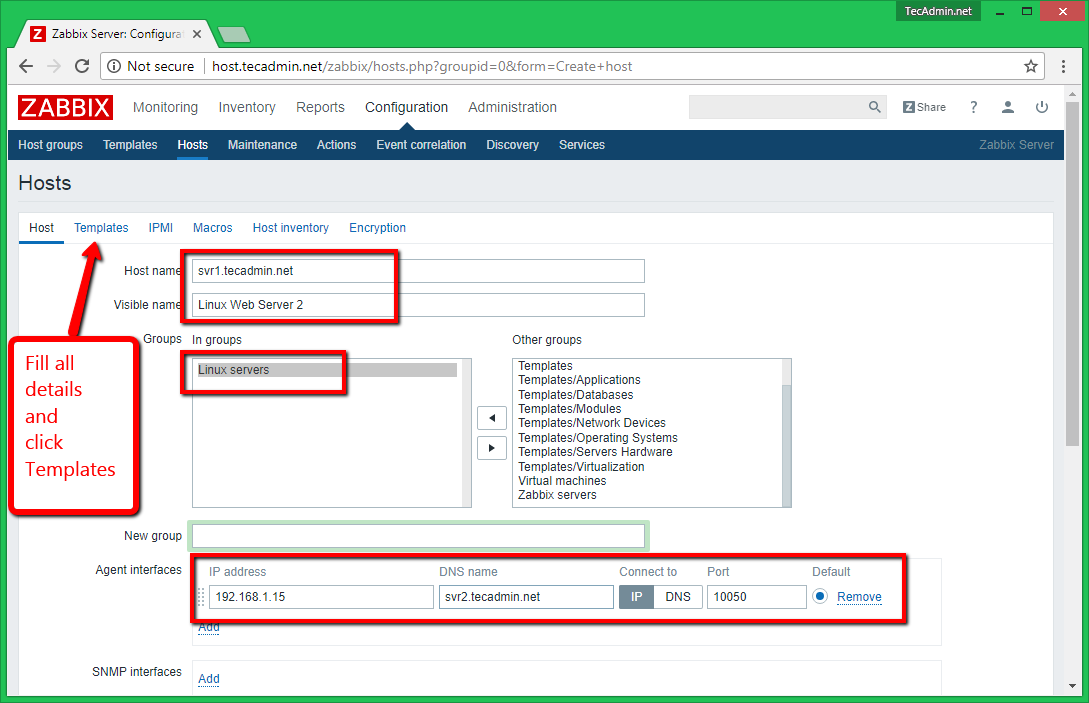
- Select an appropriate Template. Choose wisely as this determines the checks activated for the host.
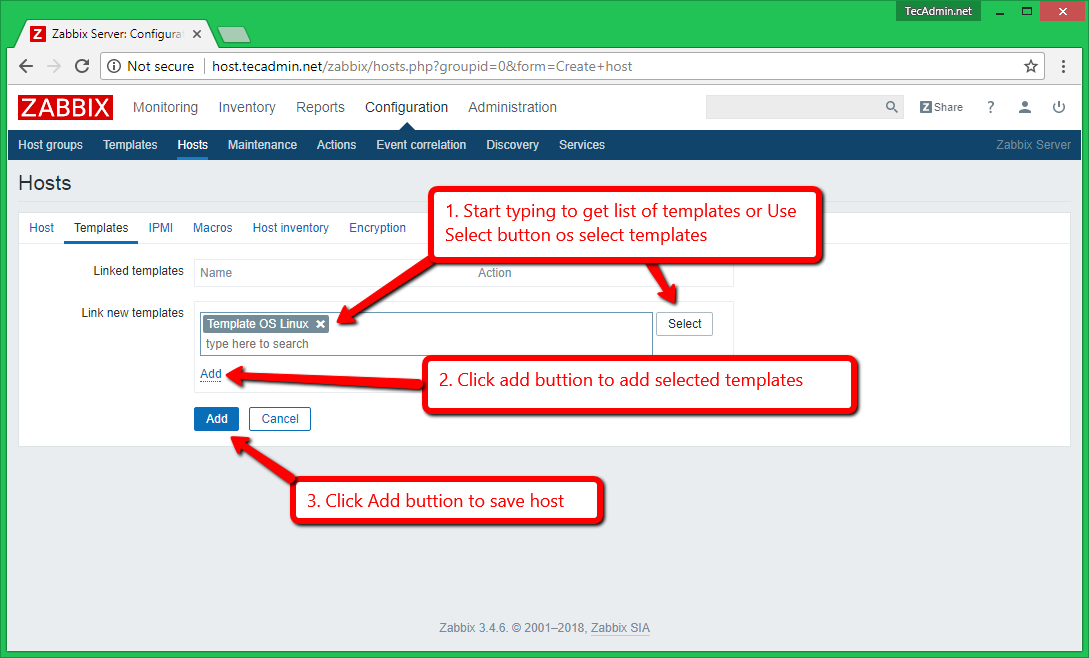
- Click on the ‘add’ link.
- Finally, click the ‘save’ button.
- The new host will be listed under hosts.
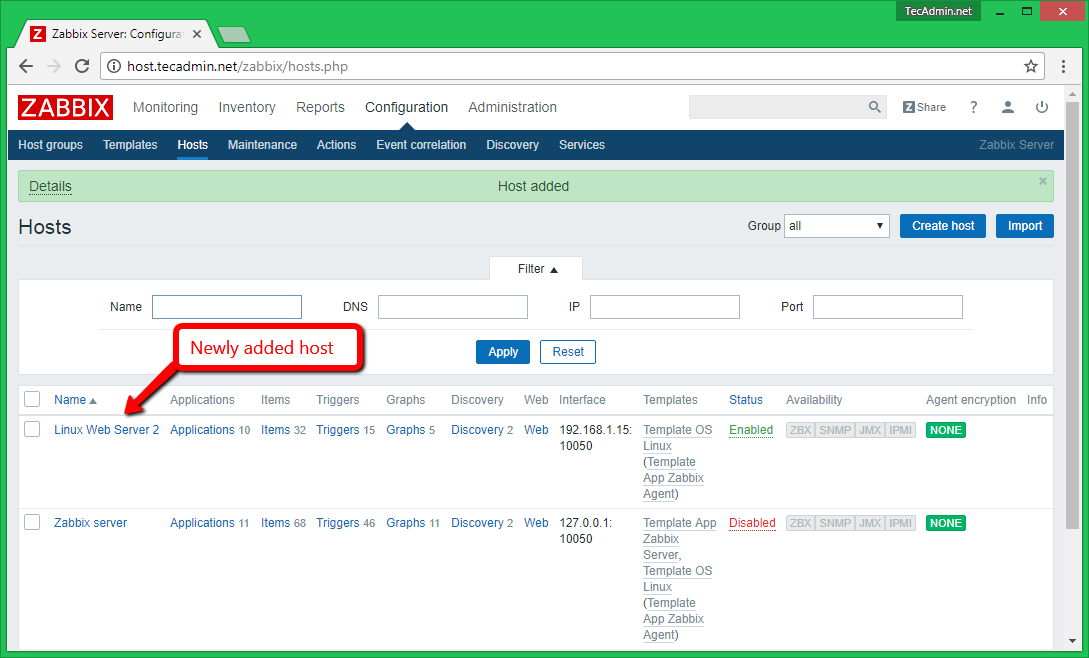
Congratulations! You’ve successfully added a new host to your Zabbix server for monitoring. To add more hosts, repeat these steps.
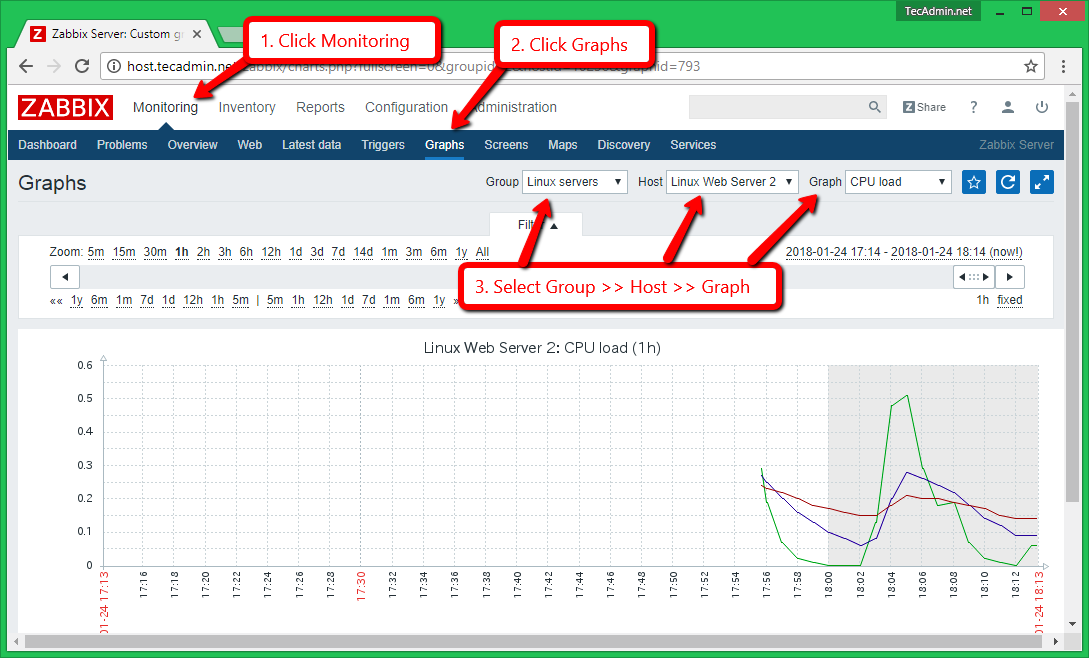
How to Access Graphs in Zabbix
Graphs are a valuable feature for new users. The screenshot below guides you in viewing graphs in Zabbix. After adding a host, allow some time for Zabbix to gather data from the remote host, which will then be displayed in the graph.
Conclusion
In summary, this guide has outlined a comprehensive method for adding new Linux hosts to your Zabbix server, emphasizing manual addition. This process is crucial for effective network monitoring and management. The steps provided are user-friendly and designed to ensure a smooth integration of your remote systems into the Zabbix monitoring environment.
By following the instructions carefully, you can efficiently monitor various aspects of your network’s performance and health. It’s important to select the appropriate templates for each host to ensure accurate monitoring and data collection. Additionally, the guide briefly touched upon how to view monitoring graphs in Zabbix, an essential feature for analyzing the performance and status of your hosts. This guide aims to assist both beginners and experienced users in enhancing their network monitoring capabilities using Zabbix.
Thank you for referring to this guide. If you found it useful, please consider sharing it with your colleagues and friends.
8 Comments
Hello guys.
The avainilbity still grey
When i add a host i get this error:
Get value from agent failed: cannot connect to [[10.89.0.19]:10050]: [4] Interrupted system call
Hi
I followed the instruction and I get this error message on my zabbix log file:
[Z3001] connection to database ‘zabbix’ failed: [1044] Access denied for user ‘zabbix’@’localhost’ to database ‘zabbix’
It’s helpful article. And as you wish I’ll forget to share it with anyone.
here a nice lab for Zabbix begginers and IT professionals…
Thanks for writing this article. It helped a lot in setting up an Asterisk Agent. Your pictures are very easy to understand. Would be nice to know more about active and passive agents.
iam configuring zabbix server how to get email alerts to my mail
Good article. Very helpfull for people learning zabbix