
Sysstat is a powerful and flexible tool for monitoring system performance on Linux-based systems. It provides detailed information about various system statistics, including CPU utilization, memory usage, disk I/O, network traffic, and system load. In this article, we will provide a comprehensive guide to getting started with Sysstat on Ubuntu.
Sysstat Utilities
The sysstat package provides a number of utilities for collecting the system use activities and system performance.
- iostat – Used for CPU statistics and input/output statistics for the block devices and partitions and generate reports.
- mpstat – Used for processor related statistics and reports.
- pidstat – Used for I/O, CPU, and memory statistics for Linux processes and generating reports.
- tapestat – Used for the statistics for tape drives attached to Linux system.
- cifsiostat – Used for generating reports CIFS statistics.
- sar – Used for collecting and saving all the system activities and reports.
Step 1 – Install Sysstat on Ubuntu
The sysstat package is available in default package repositories, You can install using the following commands. But the default repositories have an older version of packages. So we recommend using installation with source in the next step. If you still want to use the package manager just run the below commands.
sudo apt install sysstat -y
Step 2 – Configure Sysstat
By default Sysstat monitoring is disabled. To enable the sysstat monitoring, edit the configuration file in a text editor:
You need to Let’s enable the sysstat monitoring. Edit the following file and save it.
sudo vim /etc/default/sysstat
Set ENABLED to true as below:
1 | ENABLED="true" |
Save the file and close it.
After enabling the monitoring, enable the sysstat service and start it by executing:
sudo systemctl enable sysstatsudo systemctl start sysstat
Step 3 – Realtime Monitoring with Sysstat
You can get real-time system static with sar command line tool. Below is some about various static to view on the command line.
- Current CPU Usage – Use -u with the sar command to view real-time cpu statics
sar -uYou can also view the real-time CPU uses by specifying the time interval and the number of times to show data. For example, to view real-time CPU uses for 5 times with a difference of 1 second.
sar -u 1 5You can view the CPU utilization data in more depth. Nowadays most the CPUs are multi-core. To view the utilization details of each core individually use the
-P ALLcommand.sar -P ALL 1 3 - View Device Usage – Use the iostat command to find disk statics. It shows the current data transfer per second, the total number of blocks read and written to disk and an average block per second.
iostat -d 1 5Details:
- tps – Transfers per second.
- Blk_read/s – Total amount of data read in blocks per second.
- Blk_wrtn/s – Total amount of data written in blocks per second.
- Blk_read – Total blocks read.
- Blk_wrtn – Total blocks written.
You can view more extended I/O statics of the disk using the following command.
iostat -x 1 5 - View Running Process Resource Utilization – Using pidstat command with switch
-dprovides you details of currently running processes on systems.pidstat -dAlso, try pidstat with -r to show resource utilization by processes on every 1 second for the 5 times.
pidstat -r 1 5 - Memory Utilization Data – Use sar command with
-rto view the current memory utilization details 5 times every 1 second.sar -r 1 5
Step 4 – View Historical Data with Sysstat
Sysstat also stores monitoring data in files. You can also see the historical data with the sar command. By default it keeps 7 days of data bu you can change the number of days in /etc/sysstat/sysstat file.
1 | HISTORY=28 |
All the log files are stored under the /var/log/sysstat directory. The filenames will be as sa1, sa2 and so on, here 1 and 2 is the date of the current month.
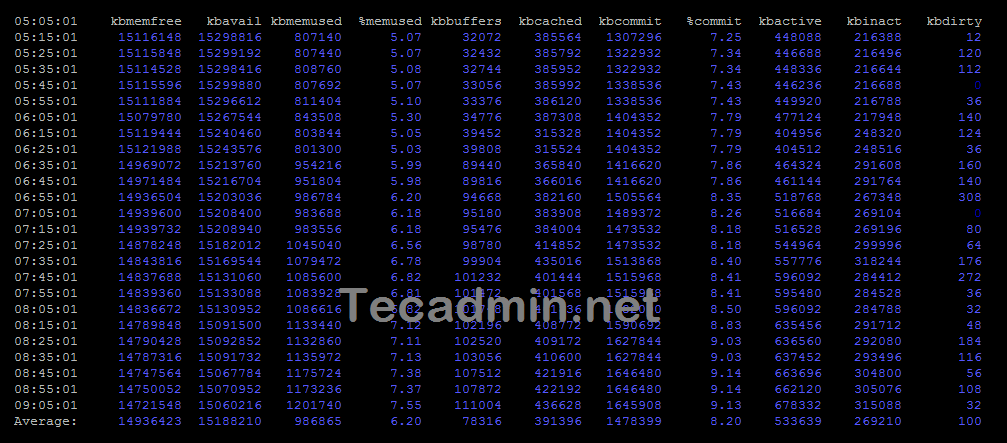
For example to view the memory utilization report of date 15’th of the current month, type:
sar -r -f /var/log/sysstat/sa15
Here we provide the file of the required date with the -f option to view historic sar data.
You can also specify a time range with the above command to view static between given times only. To view static between 7:00 AM and 8:00 AM, type:
sar -r -f /var/log/sysstat/sa15 -s 07:00:00 -e 08:00:00
Similarly, you can use the following command to view CPU utilization data of any date with sar command.
sar -u -f /var/log/sysstat/sa28
Conclusion
Sysstat is a powerful tool for monitoring system performance on Ubuntu. It provides detailed information about various aspects of system performance, including CPU utilization, memory usage, disk I/O, network traffic, and system load. In this article, we have provided a comprehensive guide to getting started with Sysstat, including installation, data collection, and data analysis. Whether you are a system administrator or a software developer, Sysstat is an essential tool for maximizing system efficiency and ensuring that your systems are performing at their best.