Google Chrome DevTools (developer tools) is the browser’s built-in comprehensive toolkit for developers. Which provides a large number of information that is useful for the developers for debugging purposes. You can also find the website’s request headers and response header values directly with dev tools.
View HTTP Headers in Chrome
Follow the below steps to open developer tools in Google Chrome and view HTTP header values.
Advertisement
- Open DevTools: You can open Google Chrome’s developer tools with two methods. Choose any one method:
- Right-click on the browser and click Inspect
- Press F12 function button in the keyboard.
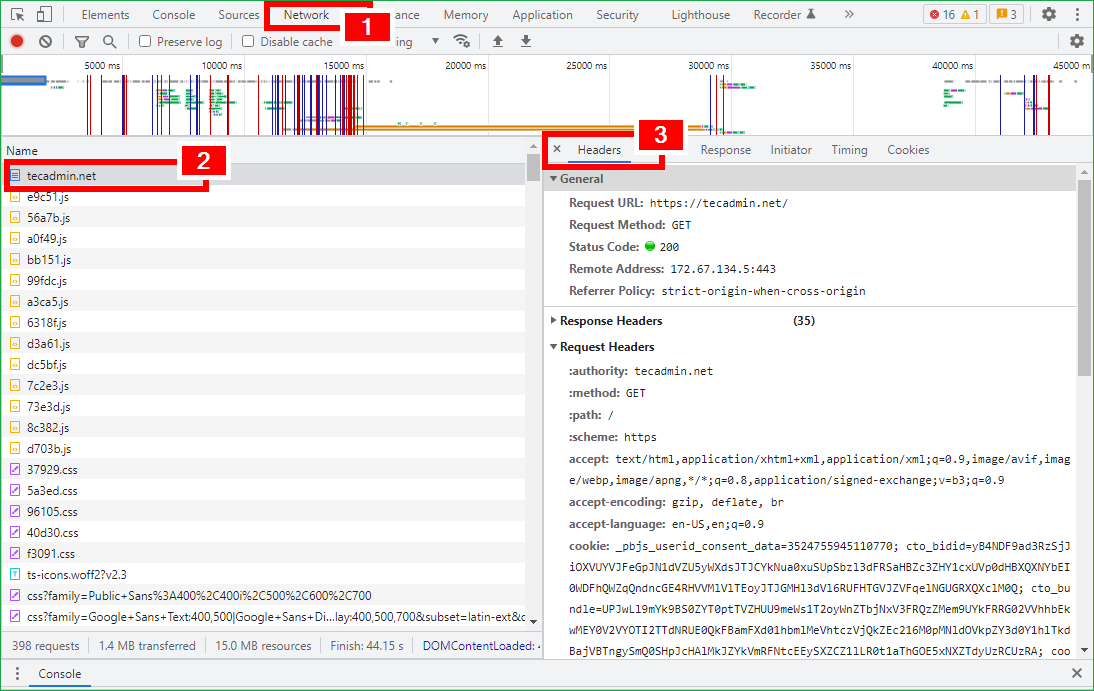
- View HTTP headers: Open the target website in the browser. The developer tools will show you a large number of details that is helpful for the developers. Once the website is loaded, you can find header values as shown below:

Viewing the HTTP Headers in Google Chrome
