The htop command is like a newer and better version of the top command. It allows us to scroll vertically and horizontally, to view all the processes running on the system. We can the process tree, select, and act on multiple processes at once. Provides an option to directly run strace on any process.
The htop command provides more detailed information about your computer’s processes than the original version. The htop command can help you find out which process is using the most CPU, how much memory each process is using, and more. You can also use the htop top command to change CPU priorities to improve the performance of your computer.
Htop Installation
Some of the modern operating systems included htop as the default installation. Also, most of the distros have htop in the default package managers. You can easily install htop on Linux with the default package management tool. Use one of the following commands to install Htop as per the Linux distro.
Using Package Manager
sudo apt install htop# For Debian Based Systems sudo yum install htop# For RedHat Based Systems sudo pacman -S htop# Arch Linux
If the default package manager doesn’t contain the htop binary. You can visit the official documentation to download the htop source and install it manually.
The Htop Command
The Htop command is a Linux command that displays real-time information about your computer’s processes. This information includes how much CPU and memory each process is using. The Htop command is very helpful when you want to troubleshoot problems with your computer or optimize its performance.
Open a terminal on your system, then type “htop” and hit Enter button:
htop
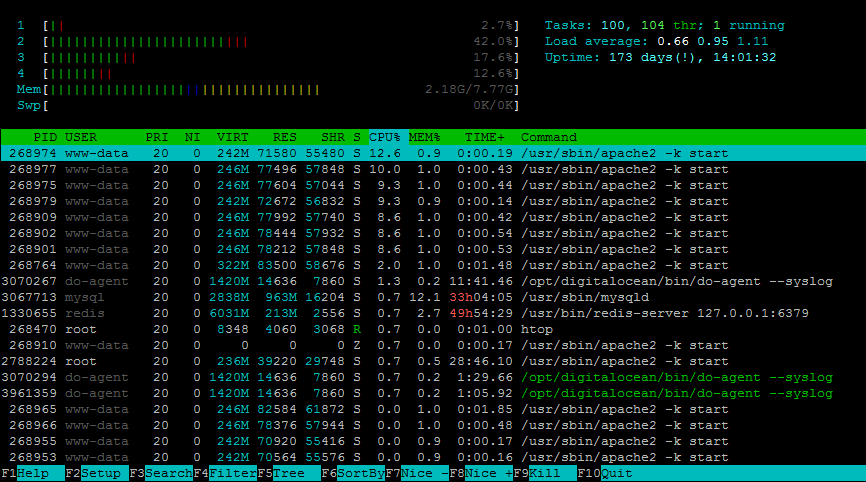
The default htop output shows Process Id (PID), Effective User Name (USER), Priority (PR), Nice Value (NI), Virtual Image (VIRT), Resident Size (RES), Shared Memory (SHR), Process Status (S), CPU Usage (%CPU), Memory Usage (%MEM), CPU Time (TIME+), Command Name (COMMAND).
- To set up the top output, press
ForShift + CorShift + Sbutton. Then you can fully customize the fields, display, colors, and many other options. - To shows processes of a single user – Press
Ubutton, then use arrow keys to select the user. Then hit Enter button to apply the change. - To kill a process, select it by navigation keys or mouse – Press
F9orKbutton and hit Enter to send the kill signal - Select a process and press
Lto list all open files by the process using lsof - To run the trace, select the process and press
Sto start trace with strace
Shortcuts Keys in Htop
The function key shortcuts display at the bottom of the result. Htop provides multiple shortcuts to change display and settings. Some of the frequently used shorts are listed below:
- F2 => Setup
- F3 or / => Incremental name search
- F4 or \ => Incremental name filter
- F5 or t => Tree view
- F6 => Change short by
- F7 => Decrease nice value
- F8 => Increase nice value
- F9 => Kill selected process
- F10 or Q => Exit from Htop command
- Shift + P => Sort by CPU
- Shift + M => Sort by Memory
- Shift + T => Sort by time
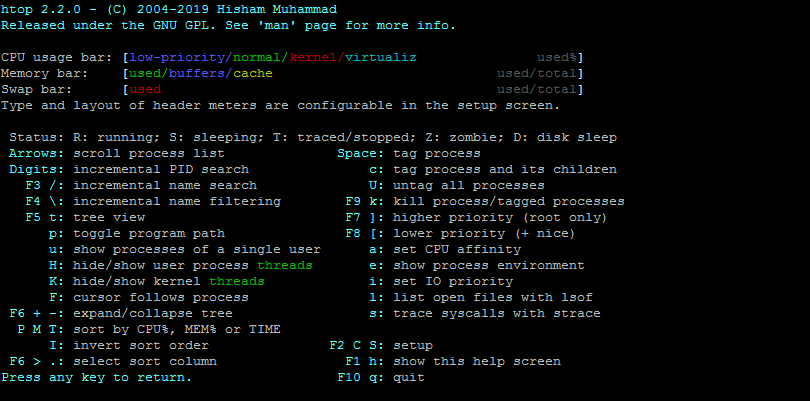
Press h key to view the all the available shortcuts with htop:
Conclusion
The htop is the enhanced version of the top command. That provides more information and control to the users. Users feel more attracted and interactive output consoles. These commands are handy for Linux users that help us to monitor the processes of your computer, troubleshoot problems, and optimize its performance.