Introduction
AWS CloudWatch provides most of the monitoring Metrics by default. But it doesn’t have any metrics for memory utilization details and Disk space uses. So if you want to monitor the memory on your system or monitor free disk space using CloudWatch. Then first you need to add these metrics to your account using custom scripts.
This article will help you to monitor EC2 Linux instance memory and disk metrics with AWS CloudWatch. Remember this will not work on any Linux machine outside the EC2 network.
Prerequsiteis
For this tutorial, you will use the Perl scripts provided by AWS team, These scripts have some dependencies. You can use the following commands to install these dependencies as per your operating systems.
Redhat Based Systems:
sudo yum install perl-Switch perl-DateTime perl-Sys-Syslog perl-LWP-Protocol-https perl-Digest-SHA
sudo yum install zip unzip
Debian Based Systems:
sudo apt-get update
sudo apt-get install unzip libwww-perl libdatetime-perl
SUSE Linux Enterprise Server
sudo zypper install perl-Switch perl-DateTime
sudo zypper install –y "perl(LWP::Protocol::https)"
Download and Configure Script
The AWS official team provides CloudWatch monitoring scripts. You can simply download the scripts and configure on your system. Use the following command to download scripts and extract on your system.
cd /opt
wget  http://aws-cloudwatch.s3.amazonaws.com/downloads/CloudWatchMonitoringScripts-1.2.1.zip
unzip CloudWatchMonitoringScripts-1.2.1.zip
Now create credentails file with coping template file.
cd /opt/aws-scripts-mon
cp awscreds.template awscreds.conf
Now, You need to add AWSAccessKeyId and AWSSecretKey of your AWS account. This will verify account ownership for the script. If you don’t have, you can create keys in your account under Users >> Security credentials section.
Test and Schedule Scripts
At this point, your setup is complete. Let’s use the following command to verify the connectivity between script and your AWS account.
./mon-put-instance-data.pl --mem-util --verify --verbose
The output will be something like below on successful verification.
Verification completed successfully. No actual metrics sent to CloudWatch.
As verification has been successfully completed. You can add the script to crontab to run on a regular interval to send data to your ec2 account. Edit crontab and add the following command to run on every 5 minutes.
*/5 * * * * /opt/aws-scripts-mon/mon-put-instance-data.pl --mem-used-incl-cache-buff --mem-util --disk-space-util --disk-path=/ --from-cron
View Metrics in CloudWatch
You should wait for some time after adding crontab. So it can collect some data to view in metrics graph. After some time
>> Login AWS Dashboard
>> Go to CloudWatch Service
>> Click on Browse Metrics button
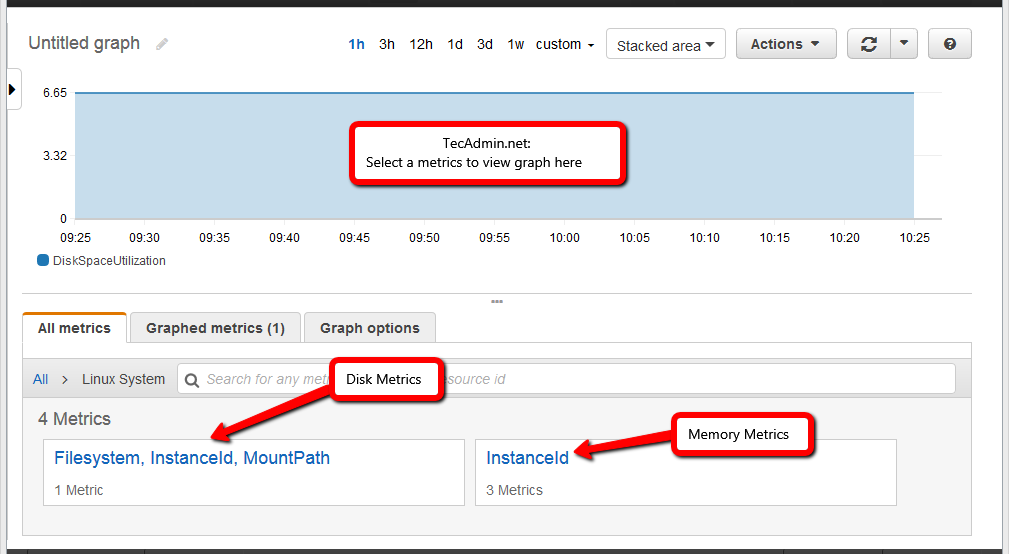
>> Select Linux System under Custom Namespaces.
Now, select any metrics to view data in Graph as shown in below screenshot.
Find Utilization Report Command Line
You can also find the resouces utilization statistics for the last 24 hours. Use the following command to get details.
./mon-get-instance-stats.pl --recent-hours=24
The output will be something like below:
Instance i-xxxxxxxxxxxxxx statistics for the last 12 hours.

CPU Utilization
    Average: 0.05%, Minimum: 0.03%, Maximum: 1.56%

Memory Utilization
    Average: 10.63%, Minimum: 10.62%, Maximum: 10.63%

Swap Utilization
    Average: N/A, Minimum: N/A, Maximum: N/A

Disk Space Utilization for /dev/xvda1 mounted on /
    Average: 6.65%, Minimum: 6.65%, Maximum: 6.65%
4 Comments
Hi Rahul,
Apart from root partition other partition are not visible in Cloud Watch. kindly share the script for all partition data.
$dimension = {};
$dimension->{‘Name’} = ‘MountPath’;
$dimension->{‘Value’} = ‘/’;
push(@{$dimensions}, $dimension);
$metric->{‘Dimensions’} = $dimensions;
my $response = call_cloud_watch(‘ListMetrics’, \%params);
if ($response->content =~ /”Value”:”\/dev\/(.*?)”/) {
my $filesystem = “/dev/$1”;
my %extra_dims = ();
$extra_dims{“MountPath”} = ‘/’;
$extra_dims{“Filesystem”} = $filesystem;
print_metric_stats($namespace, $metric_name,
“Disk Space Utilization for $filesystem mounted on /”, \%extra_dims);
It is considered best practice to use a role instead of an IAM User (at least for productions workloads).
After running the script mon-put-instance-data.pl I am getting the below error
Any sugesstions pls
perl: warning: Setting locale failed.
perl: warning: Please check that your locale settings:
LANGUAGE = (unset),
LC_ALL = (unset),
LC_CTYPE = “UTF-8”,
LANG = “en_US.UTF-8”
are supported and installed on your system.
perl: warning: Falling back to the standard locale (“C”).
LWP version 6 required–this is only version 5.833 at CloudWatchClient.pm line 26.
BEGIN failed–compilation aborted at CloudWatchClient.pm line 26.
Compilation failed in require at ./mon-put-instance-data.pl line 86.
BEGIN failed–compilation aborted at ./mon-put-instance-data.pl line 86.
Hi Rahul,
I would like to pick your brain about CLoud Watch and App Logs. So if you could please revert back to my email, I would appreciate it.