vnStat is a console-based utility which monitor network traffic ( transmit and received ) on selected network interface and stored it. This article will help you to install and setup vnStat on your server and setup web-based graph using vnstat-php application.
1. Install vnStat
vnstat packages are available under default repositories. Use the following command to install it.
admin@server1:~$sudo apt-get update admin@server1:~$sudo apt-get install vnstat Fetched 85.3 kB in 1s (50.2 kB/s) Selecting previously unselected package vnstat. (Reading database ... 448551 files and directories currently installed.) Preparing to unpack .../vnstat_1.11-2_amd64.deb ... Unpacking vnstat (1.11-2) ... Processing triggers for man-db (2.6.7.1-1ubuntu1) ... Processing triggers for ureadahead (0.100.0-16) ... Setting up vnstat (1.11-2) ... * Starting vnStat daemon vnstatd Zero database found, adding available interfaces... "eth0" added, 100 Mbit bandwidth limit. "eth1" added, 100 Mbit bandwidth limit. -> 2 interfaces added. Limits can be modified using the configuration file. [ OK ] Processing triggers for ureadahead (0.100.0-16) ...
2. Setup vnStat
After successful installation edit vnstat configuration file ( /etc/vnstat.conf ) and update Interface option as per network interface you want to monitor by vnstat. In my case I am monitoring eth1 interface.
Interface "eth1"
3. View Statistics with Command
Using vnstat command line utility you can view statistics on bandwidth on per day, per month and per hour basis. It also provides option to show statistics in real-time.
- Show Statistics for a Day
root@media60:~#
vnstat -d eth1 / daily day rx | tx | total | avg. rate ------------------------+-------------+-------------+--------------- 12/01/15 197.64 MiB | 7.84 MiB | 205.48 MiB | 43.94 kbit/s ------------------------+-------------+-------------+--------------- estimated 444 MiB | 15 MiB | 459 MiB | - Show Statistics for a Month
admin@server1:~$
vnstat -m - Show Statistics for a Hour
admin@server1:~$
vnstat -h - Show Statistics in Real Time
admin@server1:~$
vnstat -l
4. Setup vnStat Web Interface.
vnStat also provides php based web interface to show graphical statistics. In order to set up vnStat web interface, it required to have Apache, php and php-gd packages on your system.
$ sudo apt-get install apache2 php5 php5-gd
4.1. Download vnStat Source Archive
Now download vnStat php source code from its official web-page or use following command.
$ wget http://www.sqweek.com/sqweek/files/vnstat_php_frontend-1.5.1.tar.gz
Now extract downloaded archive in web accessible directory, eg: /var/www/html/vnstat
$ tar xzf vnstat_php_frontend-1.5.1.tar.gz
$ mv vnstat_php_frontend-1.5.1 /var/www/html/vnstat
4.2. Edit Configuration File
Now edit vnstat-php configuration file
$language = 'en';
$iface_list = array('eth1', 'sixxs');
$iface_title['eth1'] = 'Public Interface';
$vnstat_bin = '/usr/bin/vnstat';
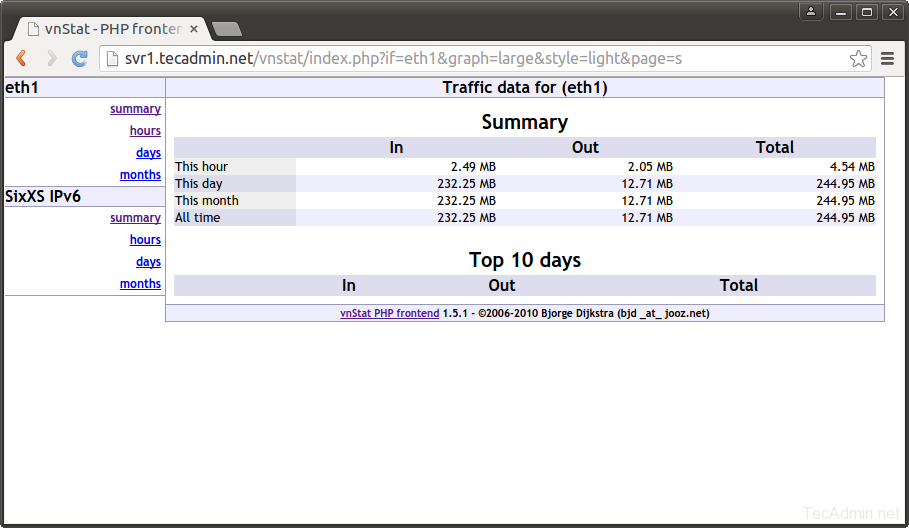
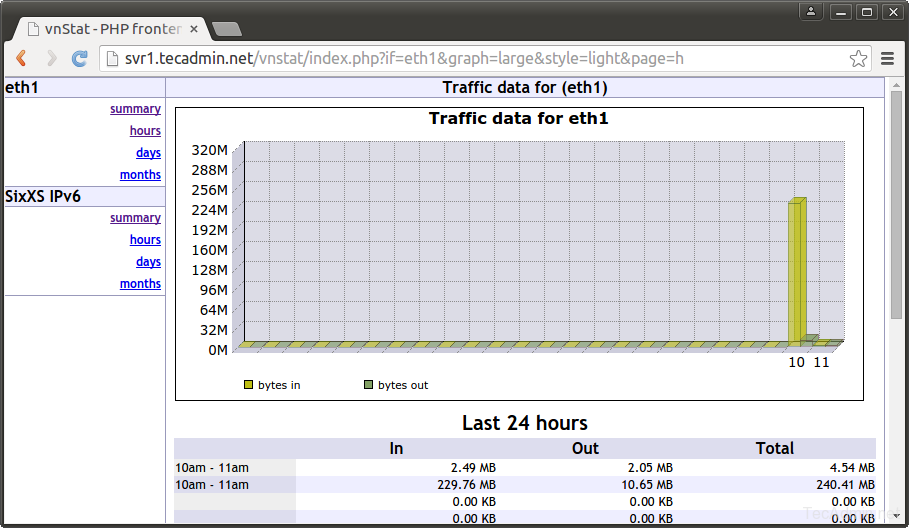
4.3. Access vnStat in Web browser
Now access vnStat in web browser using server FQDN or IP address. eg:
http://svr1.tecadmin.net/vnstat/