Monitoring your systems doesn’t have to be a chore. If you’re running an Ubuntu server and want to keep tabs on performance metrics—like CPU usage, memory, or disk I/O—Prometheus and Grafana are a dream team. Prometheus collects the data, and Grafana turns it into beautiful, easy-to-read dashboards. I’ve set this up a few times myself, and while it might seem daunting at first, it’s pretty straightforward once you break it down. Let’s walk through it together, step by step, and get your monitoring stack running on Ubuntu.
For this guide, I am running a Ubuntu 24.04 (a solid LTS release as of March 2025) system in my AWS account , but it should work fine on previous versions like 22.04 too. You’ll need sudo privileges and a basic comfort with the terminal. Let’s start configuration.
Step 1: Update Your System
First things first—let’s make sure your Ubuntu system is fresh and ready. Open your terminal and run:
apt update && sudo apt upgrade -y
This grabs the latest package lists and updates everything installed. It’s a good habit to start with, especially when you’re about to add new software.
Step 2: Install Prometheus
Prometheus is the engine here—it scrapes metrics from your system and stores them. We’ll install it manually using the precompiled binary, which gives us full control.
- Create a Prometheus User: To keep things tidy and secure, let’s set up a dedicated system user for Prometheus:
sudo useradd --no-create-home --shell /bin/false prometheus - Make Directories: Prometheus needs a couple of spots to store its data and config:
sudo mkdir /etc/prometheussudo mkdir /var/lib/prometheussudo chown prometheus:prometheus /etc/prometheus /var/lib/prometheus - Download Prometheus: Head to the Prometheus download page (or use curl to grab the latest version). As of March 2025, the latest stable release might be something like 2.53.x—check prometheus.io/download/ to confirm. Here’s how I usually download it:
wget https://github.com/prometheus/prometheus/releases/download/v2.53.4/prometheus-2.53.4.linux-amd64.tar.gzAdjust the version number if it’s different.
- Extract and Move Files: Unpack the tarball and move the binaries and config files where they belong:
tar xvf prometheus-2.53.4.linux-amd64.tar.gzcd prometheus-2.53.4.linux-amd64sudo cp prometheus promtool /usr/local/bin/sudo cp -r consoles console_libraries /etc/prometheus/sudo cp prometheus.yml /etc/prometheus/sudo chown -R prometheus:prometheus /etc/prometheus - Set Up a Service To run Prometheus automatically, create a systemd service file:
sudo nano /etc/systemd/system/prometheus.servicePaste this in:
[Unit]
Description=Prometheus Monitoring
Wants=network-online.target
After=network-online.target

[Service]
User=prometheus
Group=prometheus
Type=simple
ExecStart=/usr/local/bin/prometheus \
    --config.file /etc/prometheus/prometheus.yml \
    --storage.tsdb.path /var/lib/prometheus/ \
    --web.console.templates=/etc/prometheus/consoles \
    --web.console.libraries=/etc/prometheus/console_libraries

[Install]
WantedBy=multi-user.target
Save it (Ctrl+O, Enter, Ctrl+X in nano) and enable the service:
sudo systemctl daemon-reloadsudo systemctl start prometheussudo systemctl enable prometheus - Check It’s Running:
Visit
http://your-server-ip:9090in your browser. If you see the Prometheus UI, you’re rock. It’s scraping its own metrics by default—pretty cool, right?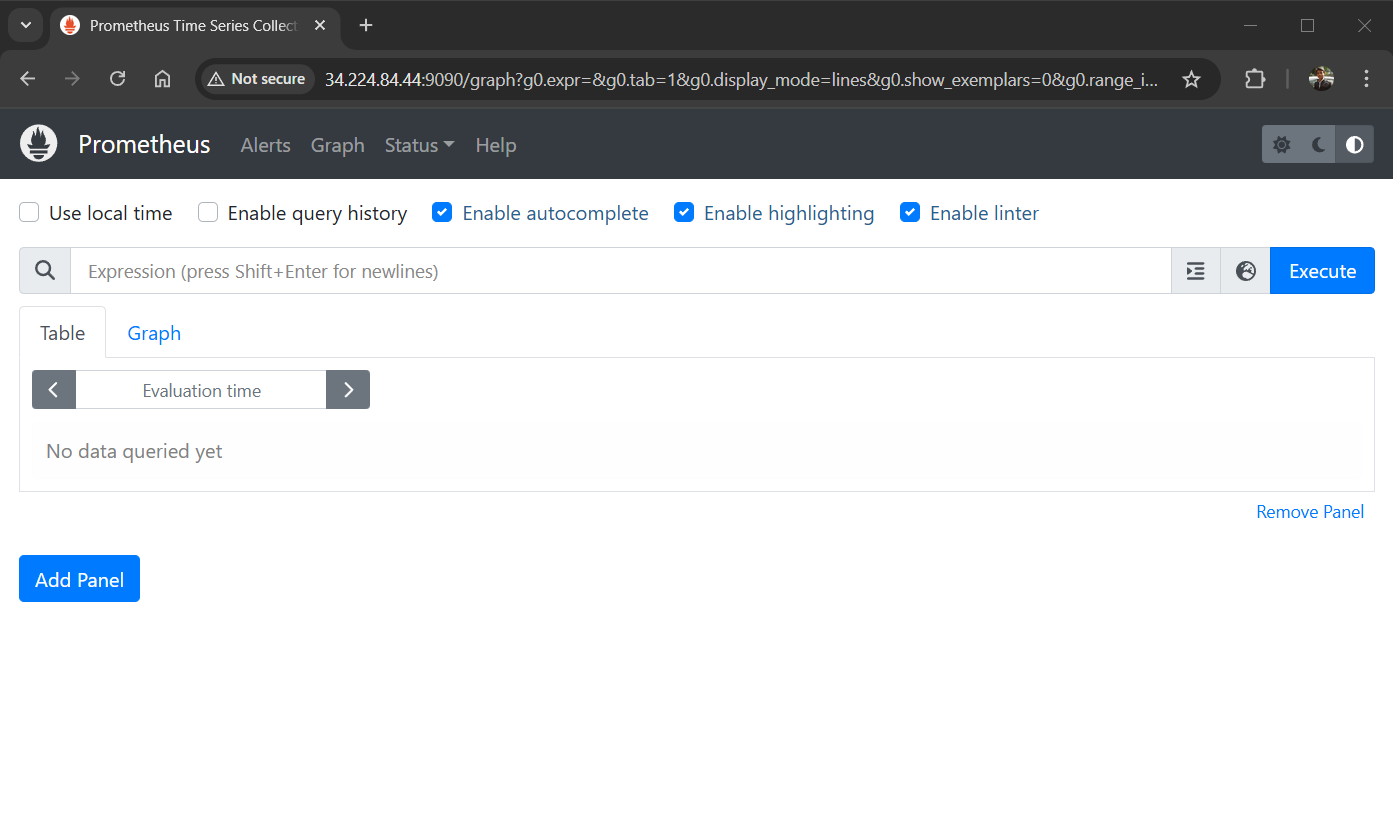
Prometheus Dashboard
Step 3: Install Node Exporter (Optional but Recommended)
Prometheus is great, but it needs exporters to pull system-level metrics. Node Exporter is perfect for this—it grabs stuff like CPU, memory, and disk stats.
- Download Node Exporter: Grab the latest version from the Prometheus download page:
wget https://github.com/prometheus/node_exporter/releases/download/v1.9.0/node_exporter-1.9.0.linux-amd64.tar.gz - Extract and Install
tar xvf node_exporter-1.9.0.linux-amd64.tar.gzsudo cp node_exporter-1.9.0.linux-amd64/node_exporter /usr/local/bin/sudo useradd --no-create-home --shell /bin/false node_exportersudo chown node_exporter:node_exporter /usr/local/bin/node_exporter - Set Up a Service: Lets create a systemd file first
sudo nano /etc/systemd/system/node_exporter.serviceAdd this:
[Unit]
Description=Node Exporter
Wants=network-online.target
After=network-online.target

[Service]
User=node_exporter
Group=node_exporter
Type=simple
ExecStart=/usr/local/bin/node_exporter

[Install]
WantedBy=multi-user.target
Save, then start it:
sudo systemctl daemon-reloadsudo systemctl start node_exportersudo systemctl enable node_exporter - Update Prometheus Config: Edit /etc/prometheus/prometheus.yml:
sudo nano /etc/prometheus/prometheus.ymlAdd this under scrape_configs:
- job_name: 'node_exporter' static_configs: - targets: ['localhost:9100'] - Restart Prometheus:
sudo systemctl restart prometheus
Step 4: Install Grafana
Now, let’s get Grafana running to visualize all this data. It’s the pretty face of our setup.
- Add Grafana Repository: Install some dependencies first
sudo apt install -y apt-transport-https software-properties-common wgetThen add the GPG key and repo:
wget -q -O - https://packages.grafana.com/gpg.key | sudo apt-key add -echo "deb https://packages.grafana.com/oss/deb stable main" | sudo tee /etc/apt/sources.list.d/grafana.list - Install Grafana: Run the following command to grafana on your Ubuntu system.
sudo apt updatesudo apt install grafana -y - Start Grafana: Enable and start it:
sudo systemctl start grafana-serversudo systemctl enable grafana-server - Access Grafana: Go to
http://your-server-ip:3000. Log in with the default credentials:admin/admin.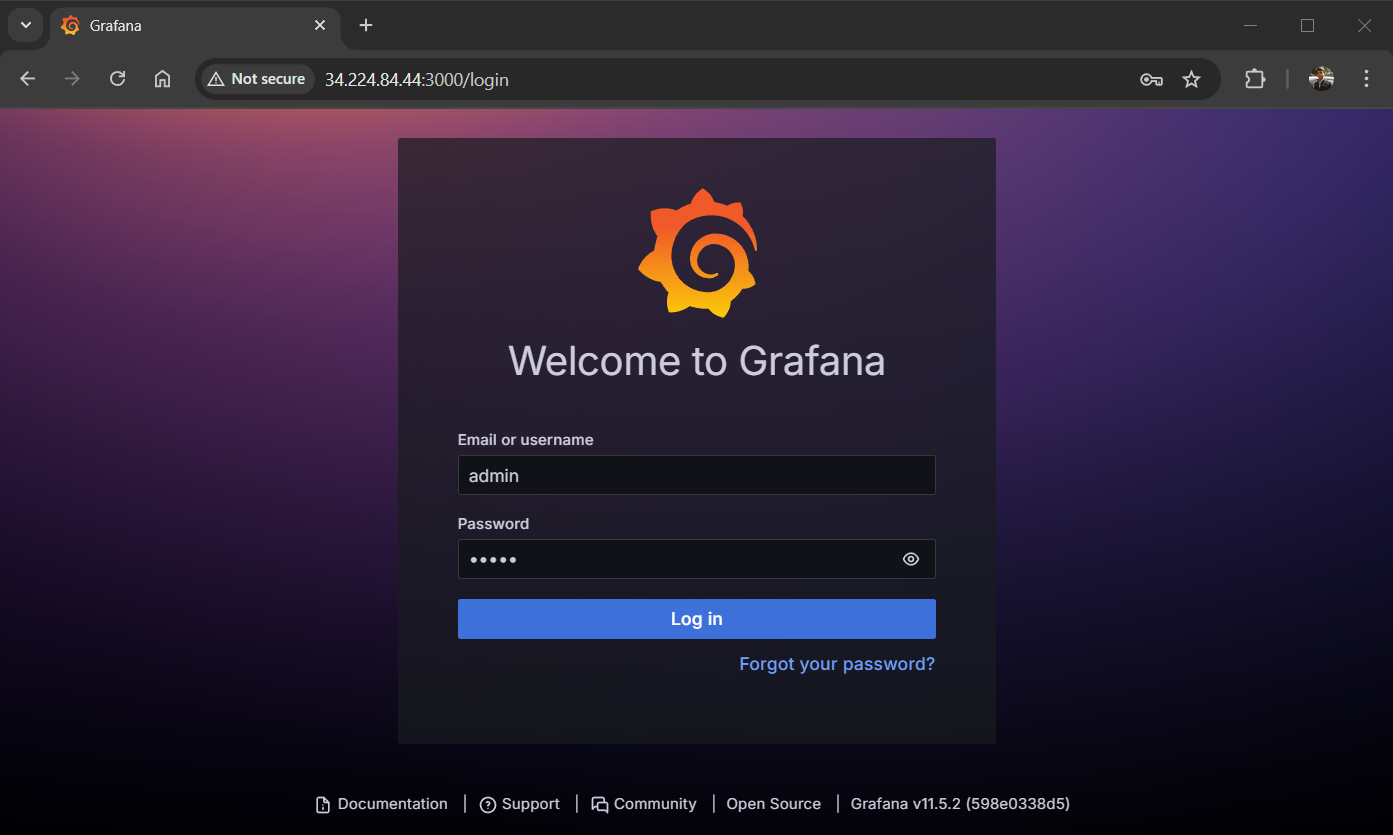
Grafana login screen After login, It will prompt you to change the password—do it.
Step 5: Connect Grafana to Prometheus
Now its time to tie it all together.
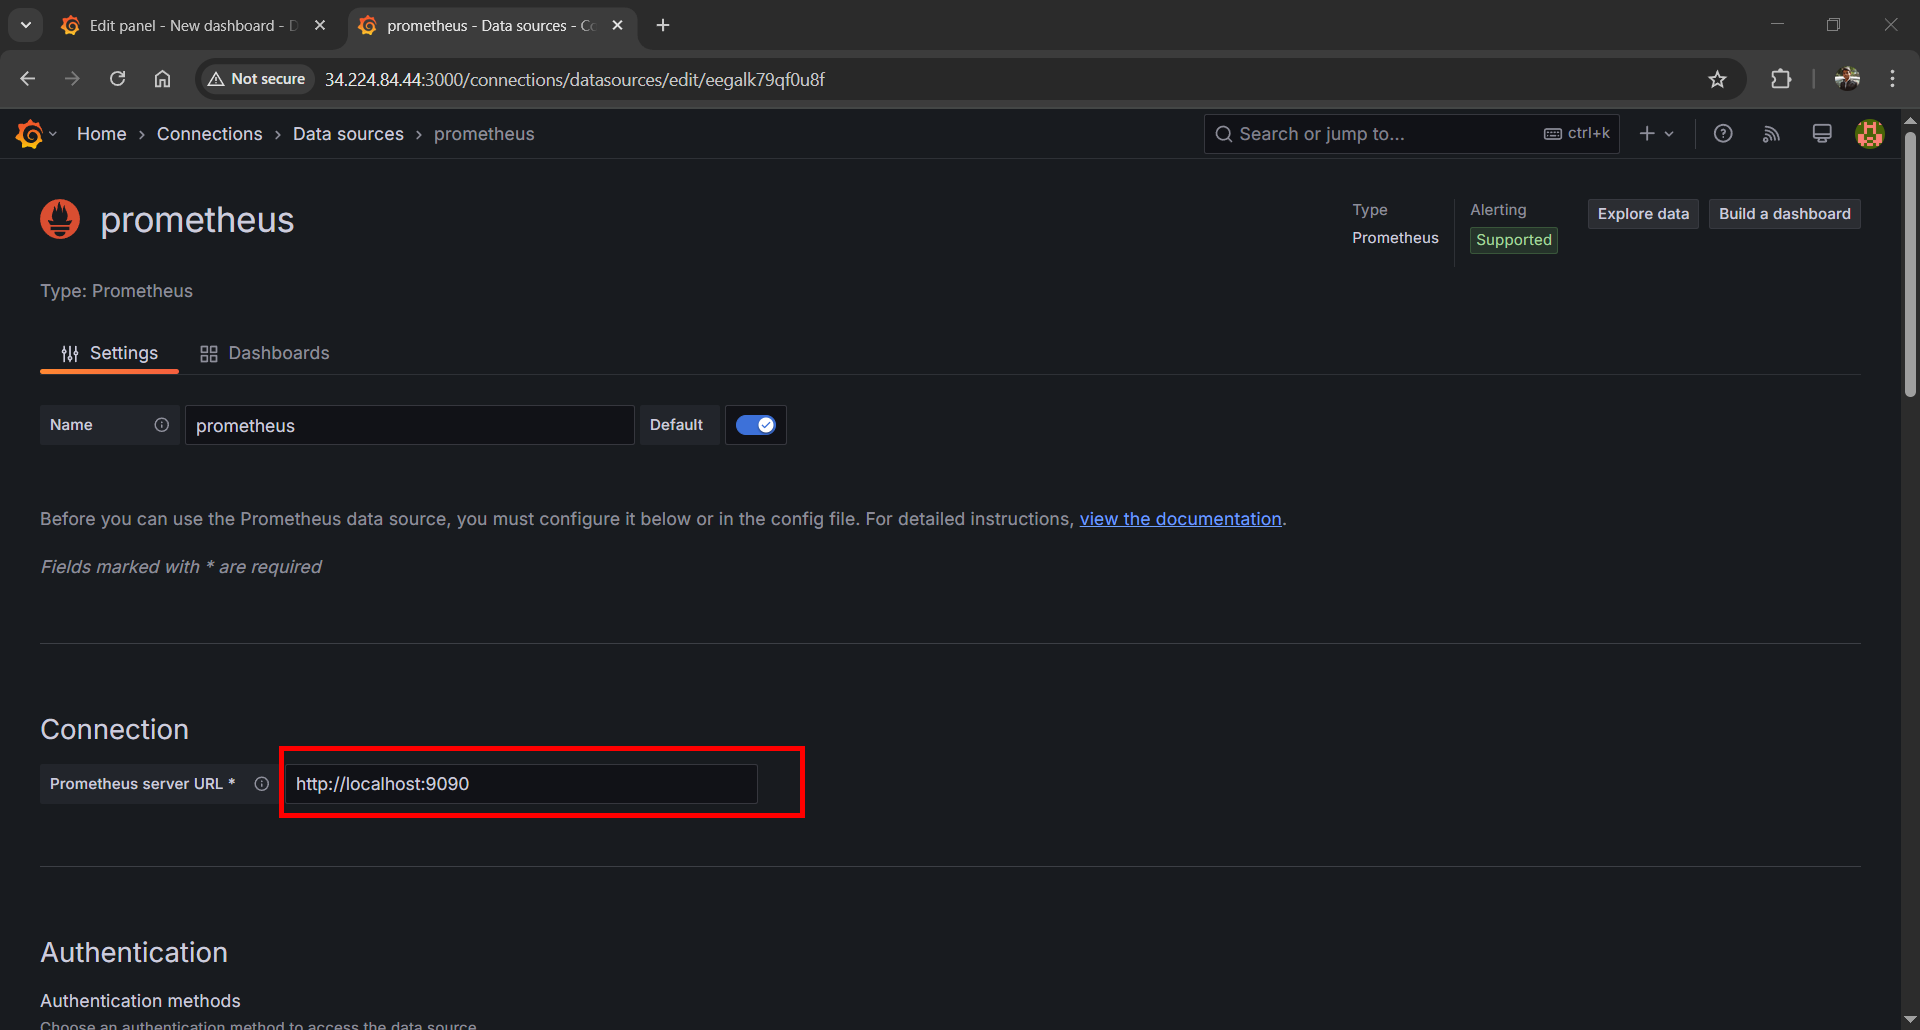
5.1. Add Prometheus as a Data Source
- In Grafana, click the gear icon (Configuration) > “Data Sources” > “Add data source”.
- Select “Prometheus.” Set the URL to http://localhost:9090 (or your server’s IP if it’s remote).
- Click “Save & Test” —if it says “Data source is working,” you’re set.
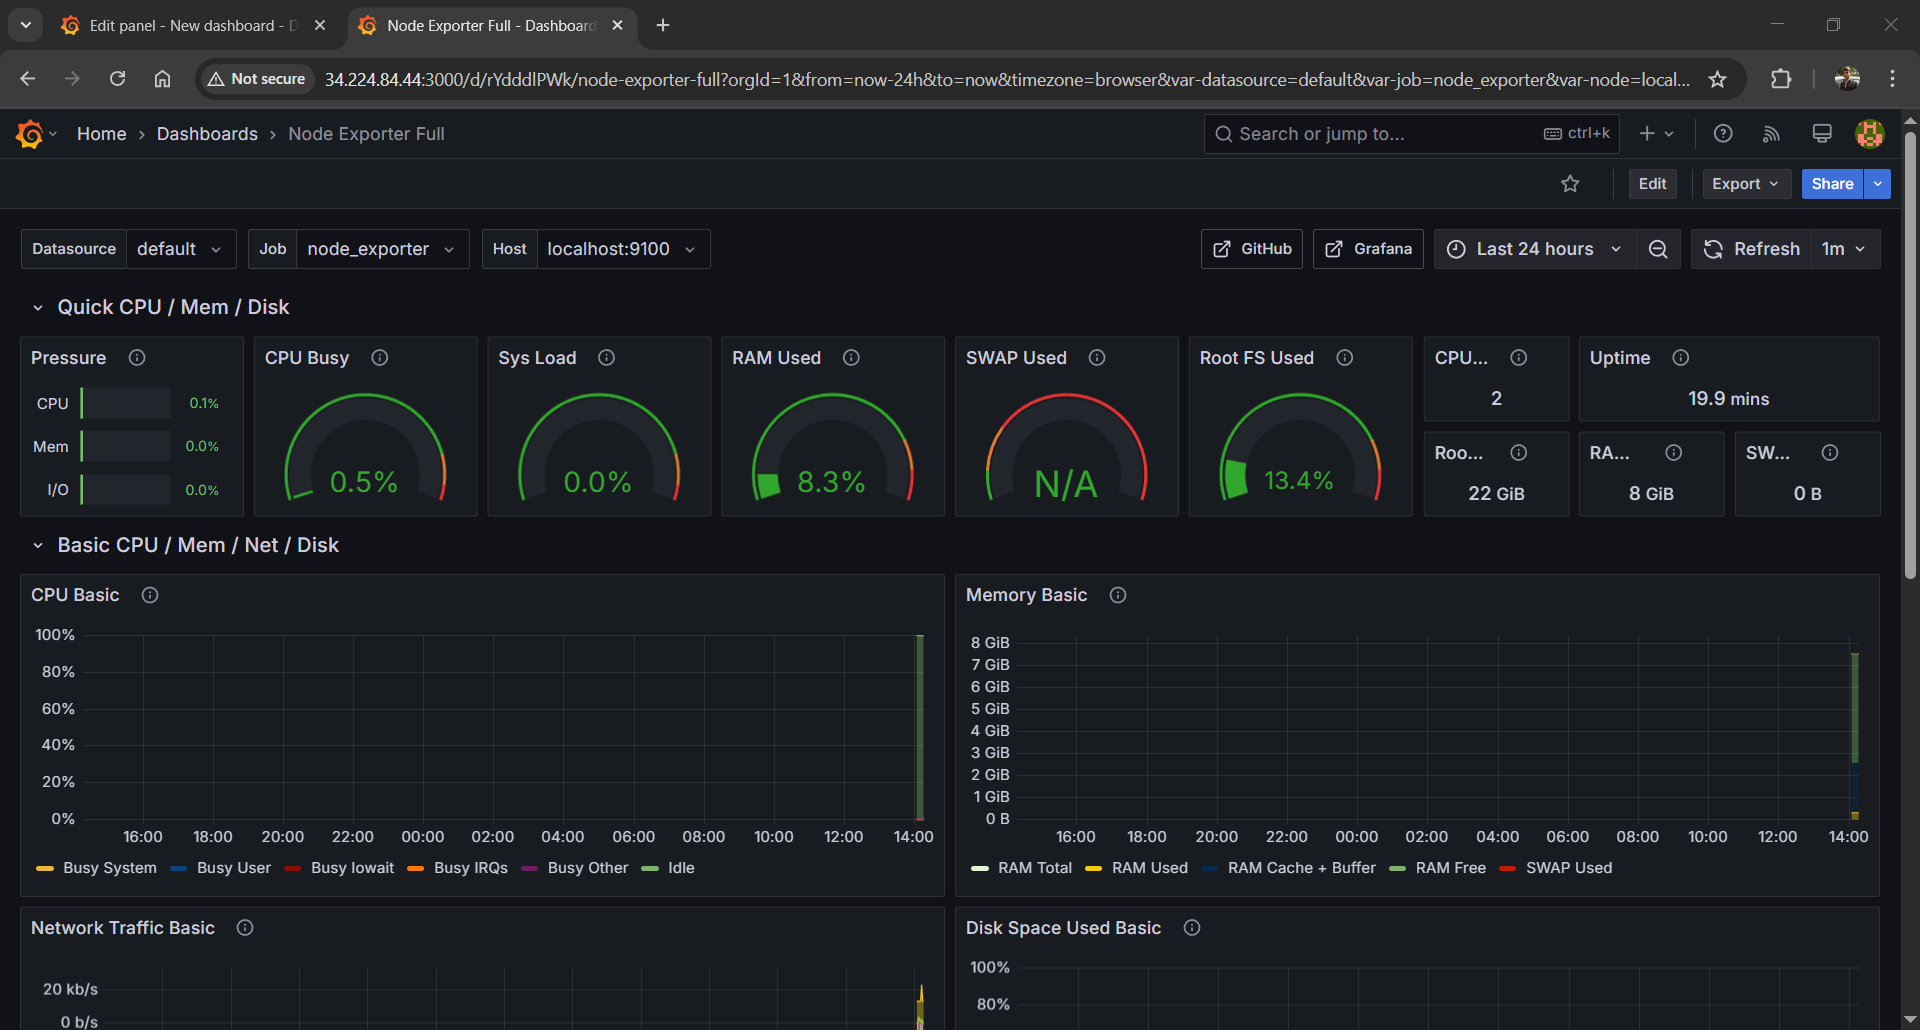
5.2 Import a Dashboard
- Click the “+” icon > “Import”.
- Use dashboard ID 1860 (Node Exporter Full—it’s a classic).
- Select your Prometheus data source and hit “Import”.
- All set, you’ve got a slick dashboard showing your system metrics.
You can use any pre defined dashboards for various data sources based on your requirements.
Step 6: Explore and Customize
Take a minute to poke around. Grafana’s dashboards are super flexible—you can tweak panels, add alerts, or build your own from scratch. If you’re monitoring more than one machine, just install Node Exporter on each and update your prometheus.yml with their IPs.
Wrapping Up
That’s it! You’ve got Prometheus scraping metrics and Grafana showing them off. It’s a powerful combo—once you start digging into the data, you’ll wonder how you managed without it. I’ve used this setup to catch memory leaks and disk issues before they became disasters. What do you think—gonna give it a shot? Let me know how it goes!