Linux provides several powerful tools to monitor system performance, especially memory and CPU usage. Sometimes we need to identify the processes that are consuming high memory and CPU to troubleshoot performance issues. You can use preinstalled system utilities like ps, top commands or external tools like htop, vmstats etc. Each tool comes with different advantages.
This article explains how to identify the top processes consuming memory and CPU using simple commands.

1. Using the ps Command
The ps command is one of the most versatile tools for displaying information about running processes. You can easily filter the output fields and sort them based on specific criteria.
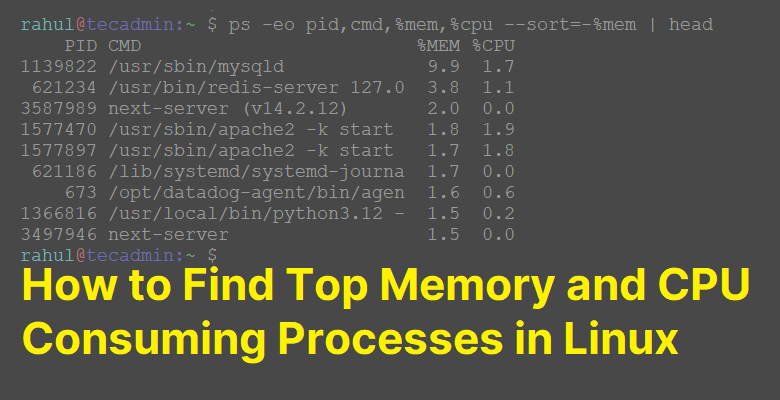
By Memory Uses: To list the top 10 processes by memory usage, you can use the following command:
ps -eo pid,cmd,%mem,%cpu --sort=-%mem | head

This output shows the processes sorted by memory usage along with their PID, command and CPU usage.
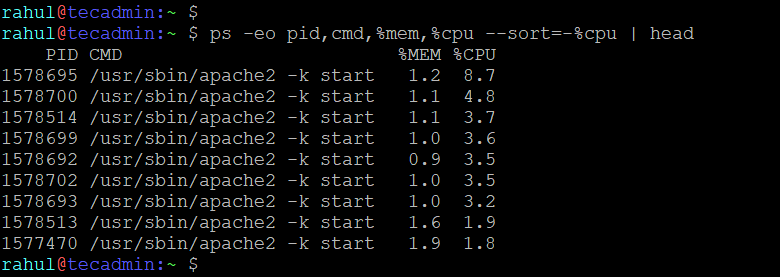
By CPU Uses: To list the top 10 processes by CPU usage, execute:
ps -eo pid,cmd,%mem,%cpu --sort=-%cpu | head

This output shows the processes sorted by CPU usage along with their PID, command, and memory usage.
2. Using top Command
The top command is an interactive utility that displays real-time information about system performance, including processes consuming the most CPU and memory.
Run the Command:
top
- Press M: Sorts processes by memory usage.
- Press P: Sorts processes by CPU usage.
Customizing Output:
To list a specific number of processes and exit after displaying the output:
top -b -n 1 | head -n 17
- -b: Batch mode for scripting.
- -n 1: Refresh once and exit.
3. Combining ps with Other Commands
You can use ps in combination with other utilities like awk or grep to filter processes based on specific criteria.
Use the following command to find all the processes that are consuming more than a certain percentage of Memory:
ps -eo pid,cmd,%mem,%cpu --sort=-%mem | awk '$4 > 5.0'
This command lists processes using more than 5% of memory. Similarly you can sort output based on CPU uses.
4. Automating Process Monitoring
To automate monitoring, you can schedule commands using cron and log the results for later analysis.
Example Cron Job:
*/5 * * * * ps -eo pid,cmd,%mem,%cpu --sort=-%mem | head >> /var/log/process_monitor.log
This logs the top memory-consuming processes every 5 minutes.
Conclusion
This is an essential task to identify all the processes that consume the most memory and CPU for managing system performance. In this article you learned about commands like ps and top, that make this task easy and efficient. By regularly monitoring these metrics, you can ensure your Linux system runs smoothly and troubleshoot performance bottlenecks effectively.


