The top command is a Linux command that displays real-time information about your computer’s processes. This information includes how much CPU and memory each process is using. The top command is very helpful when you want to troubleshoot problems with your computer or optimize its performance. While there are many different top commands that can be used on Linux, the most common are ps, netstat, lsof, vmstat, and htop. These top commands can be used to view information about your computer’s processes, view information about your computer’s network connections, view information about open files and the processes that are using them, and more. The specific top command that you use will determine what information you can view.
The Top Command
The top command can help you monitor processes, view information about your computer, and more. Top commands are especially useful if you need to troubleshoot problems with your computer or optimize its performance. Let’s take a look at some of these top commands and how they can be used by Linux users.
Open a terminal on your system and just type “top” and hit Enter.
top
You will see the running processes and other resource utilization details:
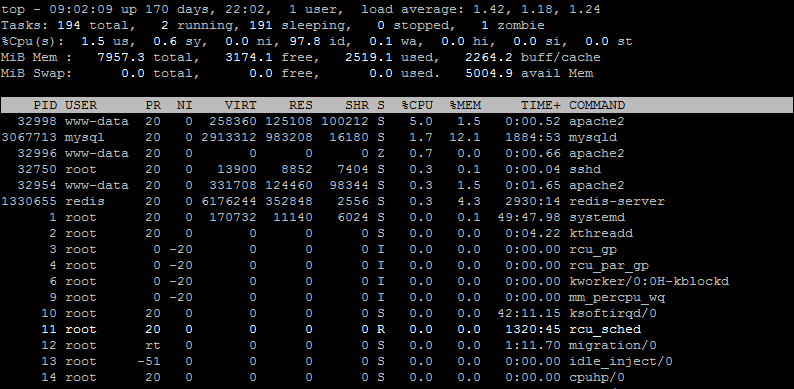
- In the output, the first part shows the resource utilization including the Memory, Swap memory, and CPU utilization. Also shows the system uptime.
- The second part shows the currently running process. It shows many details about any process but the most useful are the PID, CPU, and Memory utilization of any process.
- Simply press the ‘Q’ button to quit from top command
Change Update Interval
By default, the result updates every 3 seconds. We can overwrite this default value with -d options. For example, to update the results every 10 seconds, type:
top -d 10
You will notice that the results are updating slowly now. You can also change this at run time as well.
Top Interactive Command Shortcuts
The top comes with many interactive command shortcuts to change the output as per the requirements
- Press
Cto show the absolute path of running processes or commands. - Press
Kand enter a PID of the process to kill the running processes. - Use the Left and Right arrow keys to shift the display
- Press
Nand enter the number to display the N number of processes only. - Press
Sand input the seconds to adjust change delay.
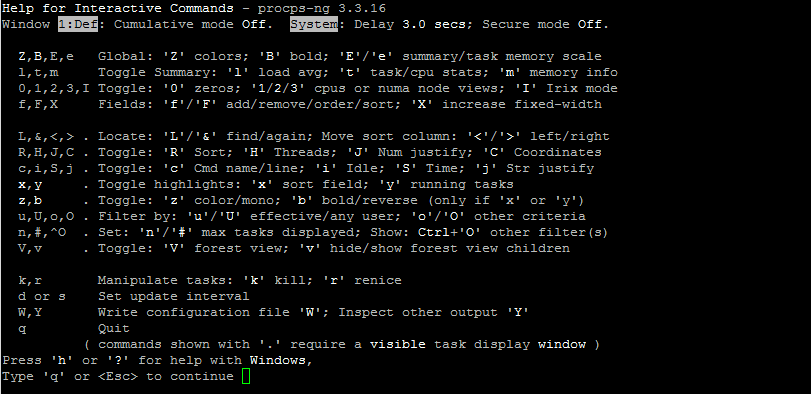
Check the below screenshot to find all the available shortcuts in top command:
Modify Display Fields
The default top command shows Process Id (PID), Effective User Name (USER), Priority (PR), Nice Value (NI), Virtual Image (VIRT), Resident Size (RES), Shared Memory (SHR), Process Status (S), CPU Usage (%CPU), Memory Usage (%MEM), CPU Time (TIME+), Command Name (COMMAND). There are many other filed options available to add to the current display. Also you can delete any field from the display or change the order of fields.
For the filed management, run the top command and press the F button. You will see the screen below:
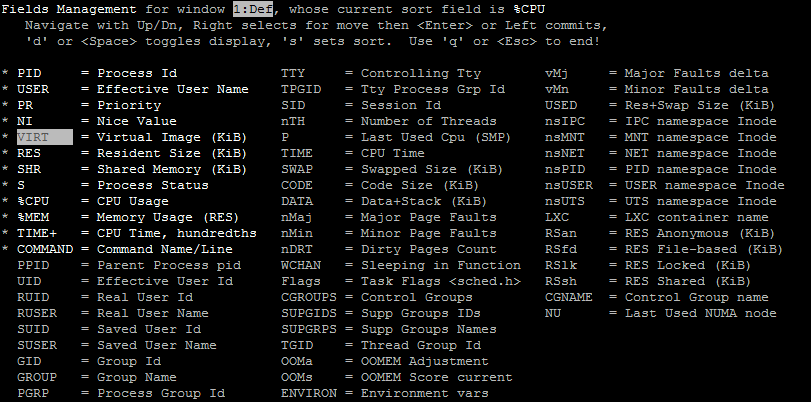
Currently, active fields in the command output are marked with an asterisk (*) in the prefix.
- Use the keyboard UP and DOWN arrow key buttons to navigate between fields
- Press the
DorSpacebarbutton to toggle the selection. - To change the order of fields in the output. Press the Right arrow to select the field, then use the UP and DOWN arrows to move. Hit Enter button to apply changes
- You can also change the default sort field. Press the
Sbutton to set the default sort filed in the output. Currently, the short field can be seen in the first row of field management options - Press
Qto go back
Conclusion
The top commands are extremely useful for Linux users. They can help you monitor the performance of your computer, troubleshoot problems, and optimize its performance. With the help of this command, we can easily find the processes consuming high memory and CPU on the system. Get the list of all processes running by the specific user.
