In the realm of Linux system administration, performance management plays a critical role in ensuring that servers and applications run smoothly and efficiently. One of the most powerful tools at your disposal for this task is Sysstat, a collection of utilities designed to monitor system performance and usage activity. This guide will introduce you to Sysstat, covering its installation, key components, and how to use it for effective Linux system performance management.
What is Sysstat?
Sysstat is a versatile toolset that allows system administrators to gather performance data and statistics about their Linux systems. It includes several utilities such as sar, iostat, mpstat, pidstat, and sa1, each serving different purposes but collectively providing a comprehensive overview of system performance.
Key Features:
- Resource Monitoring: Track CPU, memory, I/O, network, and process statistics.
- Historical Data: Collect and archive performance data for long-term analysis.
- Real-Time Monitoring: Observe system performance in real-time.
- Versatility: Use in both interactive and batch modes for reports.
Installing Sysstat
Sysstat is available in the repositories of most Linux distributions. You can install it using your distribution’s package manager.
- For Debian/Ubuntu systems:
sudo apt updatesudo apt install sysstat - For Red Hat/CentOS systems:
sudo yum install sysstat
After installation, you might need to enable data collection. This step varies by distribution, so check the documentation specific to your system. In most cases you need to edit the /etc/default/sysstat and set ENABLED="true" and save it.
Key Components and Their Usage
1. sar (System Activity Report)
The sar command is the central component of Sysstat. It collects, reports, or saves system activity information. To display CPU usage statistics, you can use:
sar 1 3
This command displays CPU statistics every 1 second, repeating 3 times.
2. iostat (Input/Output Statistics)
iostat is useful for monitoring system input/output device loading by observing the time devices are active in relation to their average transfer rates. To check the I/O statistics of your disk devices:
iostat -xz 1 3
This command provides detailed I/O statistics, updated every second, for 3 intervals.
3. mpstat (Multiprocessor Statistics)
mpstat displays statistics about CPU usage on a per-processor basis, making it valuable for systems with multiple CPUs or cores. To view CPU usage for all CPUs:
mpstat -P ALL 1 3
4. pidstat (Process Statistics)
pidstat is used for monitoring individual tasks managed by the Linux kernel. It’s helpful for tracking the resource usage of specific processes:
pidstat 1 3
This command reports statistics for all processes every 1 second, 3 times.
Analyzing Performance Data
The true power of Sysstat lies in its ability to help you analyze and interpret the performance data of your system. Regular monitoring can help identify bottlenecks, understand system behavior under different loads, and plan for capacity upgrades.
- CPU Load: High CPU usage might indicate a need for optimization or load balancing.
- Memory Utilization: Monitoring swap usage and memory can help you fine-tune application performance.
- Disk I/O: Identifying high I/O wait times can point to disk system bottlenecks.
- Network Performance: Tracking inbound and outbound traffic can help in optimizing network configurations.
Other Practical Examples
1. View Current CPU Usage
Use sar command with -u option to view CPU statics of current date.
sar -u
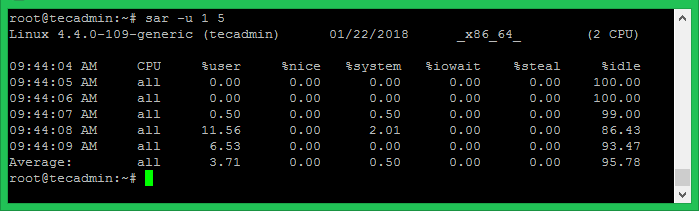
You can also view the real-time CPU uses by specifying the time interval and number of times to show data. For example, to view real-time CPU uses for 5 times with the difference of 1 second.
sar -u 1 5
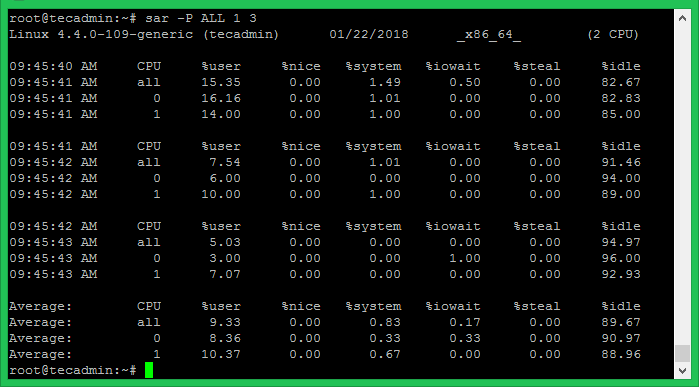
You can view the CPU utilization data in more depth. Nowadays most of the CPU’s are multi-core. To view utilization details of each core individually use -P ALL command.
sar -P ALL 1 3
2. View Device Usage
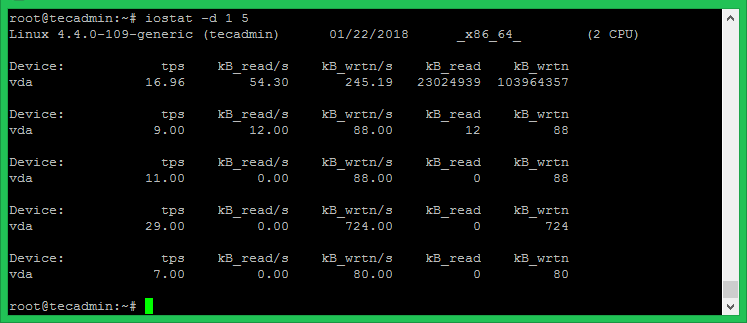
Use the iostat command to find disk statics. It shows the current data transfer per second, the total number of blocks read and write to disk and an average block per seconds.
iostat -d 1 5
Details:
- tps – Transfers per second.
- Blk_read/s – Total amount of data read in blocks per second.
- Blk_wrtn/s – Total amount of data written in blocks per second.
- Blk_read – Total blocks read.
- Blk_wrtn – Total blocks written.
You can view more extended I/O statics of disk using the following command.
iostat -x 1 5
3. View Running Process Resource Utilization
Using pidstat command with switch -d provides you details of currently running processes on systems.
pidstat -d
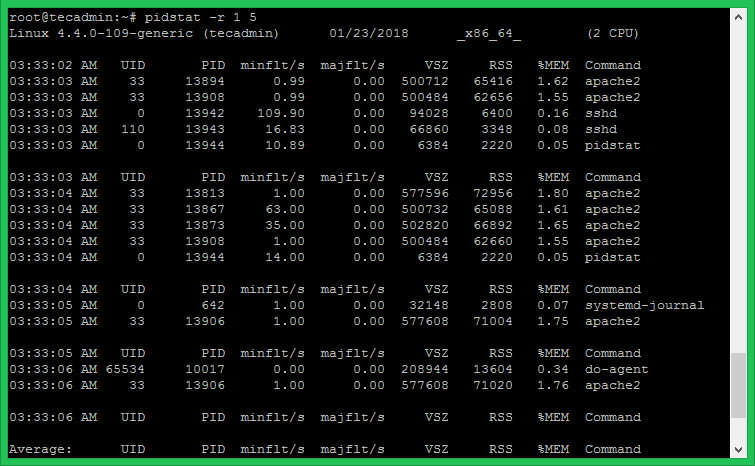
Also try pidstat with -r to show resource utilization by processes on every 1 second for the 5 times.
pidstat -r 1 5
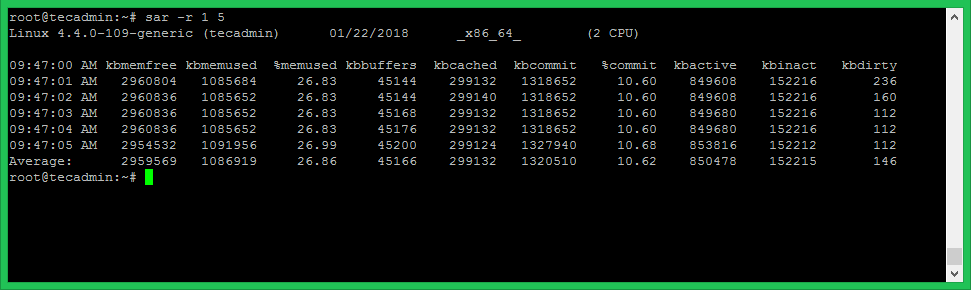
4. Memory Utilization Data
Use sar command with -r to view the current memory utilization details for the 5 times on every 1 second.
sar -r 1 5
Conclusion
Sysstat offers a goldmine of information for Linux system administrators looking to optimize performance and ensure their systems run at peak efficiency. By familiarizing yourself with its utilities and learning to interpret the data they provide, you can proactively manage system resources, troubleshoot issues more effectively, and make informed decisions about your infrastructure’s future needs. Whether you’re managing a single server or an entire data center, Sysstat is an indispensable tool in your performance monitoring toolkit.


2 Comments
Thank you so much. useful information!
Many thanks for this useful explanation, I admit I didn’t use systat and now it will be among my favorite commands.