Linux is a powerful and versatile operating system that runs on a wide range of devices, from smartphones to supercomputers. As a Linux administrator, monitoring system performance is crucial for maintaining stability, optimizing resources, and detecting potential issues before they become problems. Fortunately, Linux provides a variety of tools for monitoring and managing system performance.
In this article, we will explore 15 essential system and performance monitoring tools for Linux administrators.
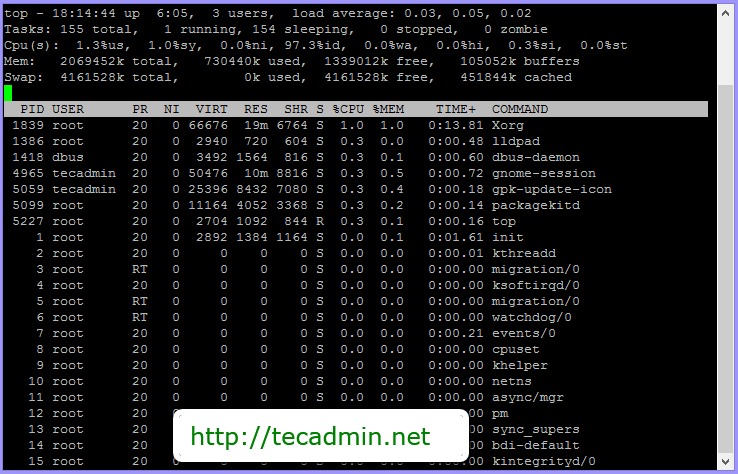
- Top
Top is a command-line utility that provides real-time information about system processes, CPU usage, memory usage, and other system statistics. It displays a list of running processes, sorted by their resource usage, and updates the list periodically. Top is an excellent tool for troubleshooting system performance issues and identifying resource-intensive processes.
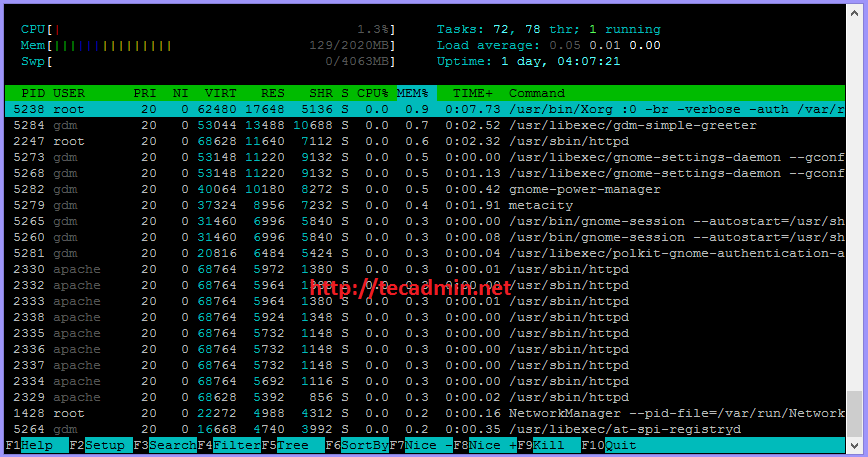
- Htop
Htop is an interactive process viewer and system monitor that is similar to Top but offers a more user-friendly interface. It allows users to navigate through the list of running processes using arrow keys, sort processes by different criteria, and filter the list by process name or user.
- ps
ps is a command-line utility that displays information about running processes on a Linux system. It provides a snapshot of the system’s current state, including the process ID (PID), the user running the process, the amount of CPU and memory used, and more. ps is a useful tool for troubleshooting and managing system resources, and it can be customized to display only the information needed for a specific task.
ps -eTo List all Processes on Server
ps auxTo List all Processes of Specific User
ps -u user_name - sar Command
sar is a command-line utility that is part of the Sysstat package. It is used for collecting and reporting system performance data over time. It can collect data on CPU usage, memory usage, disk activity, network traffic, and other system statistics. sar is a useful tool for monitoring system performance and identifying trends over time.
- strace
strace is a command-line utility that allows users to trace system calls and signals made by a process. It is useful for debugging and troubleshooting issues with applications and identifying performance bottlenecks.
- uptime Command
uptime is a command-line utility that displays the current system uptime and load average. It shows how long the system has been running, the number of users currently logged in, and the load average for the past 1, 5, and 15 minutes. uptime is a useful tool for checking the health of a system and identifying potential issues with system resources.
- ss Command
ss is a command-line utility that displays information about network sockets and connections on a Linux system. It can be used to view detailed information about TCP and UDP connections, including the local and remote addresses, the state of the connection, and more. ss is a useful tool for troubleshooting network issues and monitoring network traffic.
- Glances
Glances is a system monitoring tool that provides an overview of system resources, including CPU usage, memory usage, disk usage, network bandwidth, and more. It displays all the information in a single screen, with color-coded bars and graphs that make it easy to identify system issues.
- Iostat
Iostat is a command-line utility that provides information about input/output (I/O) operations and disk utilization. It displays the average I/O statistics over a specific interval, including the number of read and write operations, the number of kilobytes read and written, and the average response time.
- Netstat
Netstat is a command-line utility that provides information about network connections and network statistics. It displays a list of active network connections, including the protocol, local and remote addresses, and the status of each connection. Netstat is an excellent tool for troubleshooting network issues and identifying unauthorized network connections.
netstat -tulnp - vnstat
vnstat is a command-line utility that provides network traffic monitoring and reporting. It can be used to monitor network bandwidth usage on a Linux system, including the amount of data transmitted and received, and the network usage for specific network interfaces. vnstat is a useful tool for identifying network usage patterns and optimizing network performance.
Show Statistics for a day
vnstat -dShow Statistics for a Month
vnstat -dShow Statistics for a Hour
vnstat -dShow Statistics in Real Time
vnstat -d - vmstat
vmstat is a command-line utility that provides information about system memory usage, CPU usage, and other system statistics. It displays real-time data about the number of processes, the amount of free memory, the number of context switches, and more. vmstat is a useful tool for monitoring system performance and identifying potential issues that could affect system stability.
- Tcpdump
Tcpdump is a command-line packet analyzer that allows users to capture and analyze network traffic in real-time. It can capture packets from a specific network interface or filter packets by IP address, protocol, port number, and more. Tcpdump is an essential tool for network administrators who need to troubleshoot network issues or analyze network traffic.
- Nmon
Nmon is a system monitoring tool that provides a comprehensive view of system resources, including CPU usage, memory usage, disk I/O, network bandwidth, and more. It displays all the information in a single screen, with color-coded bars and graphs that make it easy to identify system issues.
- Sysstat
Sysstat is a collection of performance monitoring tools that includes utilities such as sar, iostat, mpstat, and pidstat. These tools provide system administrators with real-time information about CPU usage, disk I/O, network traffic, and other system statistics. Sysstat is an essential tool for monitoring system performance and detecting potential issues before they become problems.
- Nagios
Nagios is a popular open-source monitoring system that allows administrators to monitor system resources, network devices, and applications. It provides a centralized dashboard that displays real-time information about the status of all monitored systems, with alerts and notifications for critical events. Nagios is a versatile tool that can be customized to monitor any system or service.
- Zabbix
Zabbix is another open-source monitoring system that provides real-time monitoring and alerting for servers, network devices, and applications. It includes a powerful dashboard that displays real-time information about system performance, with alerts and notifications for critical events. Zabbix is highly scalable and can monitor thousands of systems and devices.
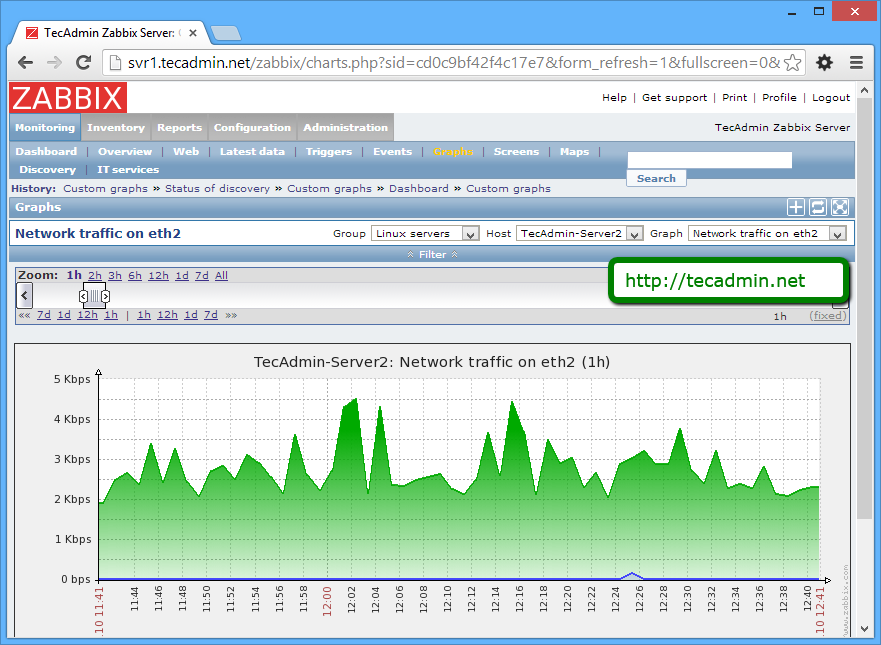
Read More Install Zabbix Network Monitoring on CentOS/RHEL and Fedora
- Collectd
Collectd is a daemon that collects and reports system performance metrics. It supports a wide range of plugins that can monitor CPU usage, memory usage, disk I/O, network traffic, and other system statistics. Collectd can send metrics to various backends, such as Graphite, InfluxDB, and Elasticsearch, for long-term storage and analysis.
- Grafana
Grafana is a powerful open-source dashboard and visualization platform that can be used to monitor and analyze system performance. It provides a flexible and customizable interface that can display real-time data from various sources, including Collectd, Nagios, and Zabbix. Grafana supports a wide range of visualization options, such as graphs, gauges, and heatmaps.
- Prometheus
Prometheus is a popular open-source monitoring system that is designed for collecting and storing time-series data. It can monitor system resources, network devices, and applications, and provides a powerful query language for analyzing and visualizing the collected data. Prometheus supports a wide range of integrations and exporters that can collect data from various sources, such as Collectd and Nagios.
- Cacti
Cacti is a network monitoring and graphing tool that can be used to monitor system performance. It provides a web-based interface that displays real-time graphs of system statistics, such as CPU usage, memory usage, and network traffic. Cacti supports various data sources, such as SNMP, and can be customized to monitor any system or service.
- Munin
Munin is a network monitoring system that can monitor system performance and generate graphs of system statistics. It includes a set of plugins that can monitor CPU usage, memory usage, disk I/O, network traffic, and other system statistics. Munin provides a web-based interface that displays real-time graphs of system performance, with alerts and notifications for critical events.
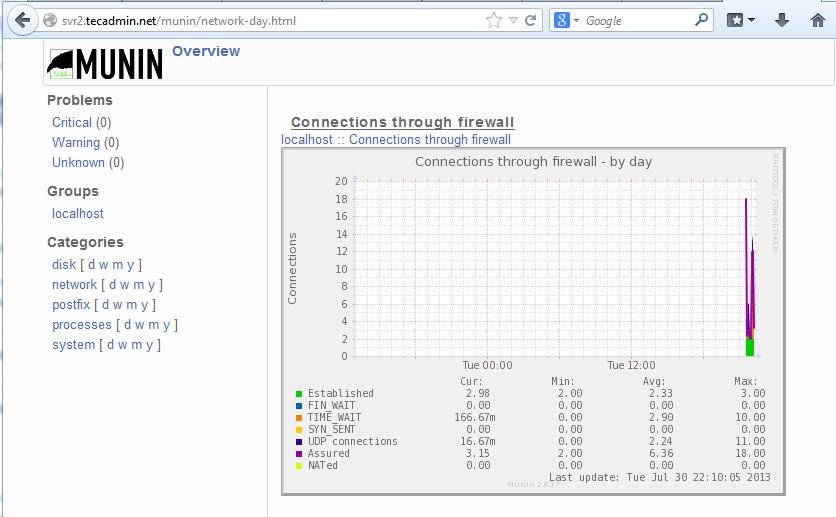
Read More: Installing Munin Network Monitoring in CentOS RHEL and Fedora
Conclusion
In conclusion, monitoring system performance is essential for Linux administrators, and there are various tools available to make this task easier. From command-line utilities like Top and Iostat to sophisticated monitoring systems like Nagios and Prometheus, there is a tool for every need and level of expertise. By using these tools to monitor and optimize system performance, administrators can ensure that their systems are running smoothly and efficiently.
2 Comments
Nice list. One more suggestion you might want to consider for monitoring tool is AgentlessMonitor from AppPerfect which covers most of the aspects of monitoring like JAVA / J2EE application monitoring, server monitoring, database monitoring, transaction monitoring, network monitoring, log monitoring and system monitoring and last, but not the least is available for free. It is very easy to use and more details can be found at http://www.appperfect.com/products/agentless-monitor.php
Thanks!